

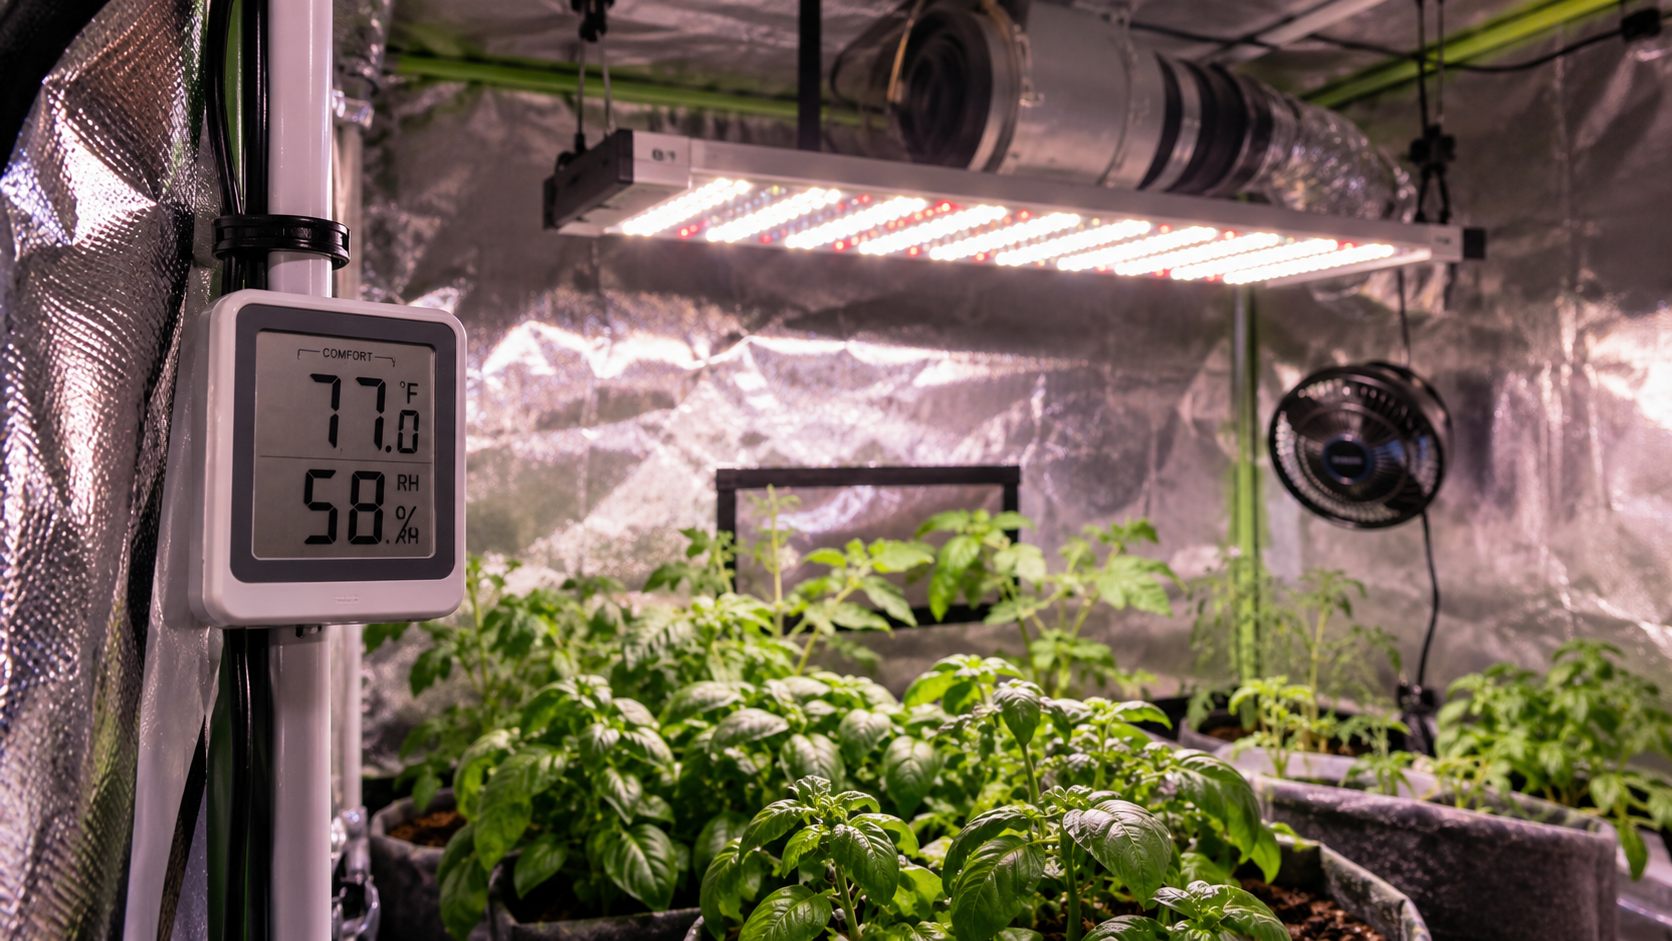
You check your tent — 78°F, 55% humidity, everything “in range” — and your plants still look stressed. Leaves curl at the tips, growth stalls, and no amount of nutrient tweaking fixes it. This is usually a VPD chart for veg and flower problem, not a feeding problem — and if you’re still fuzzy on what VPD actually is and how it’s calculated, our breakdown of what VPD means and why it matters is worth a quick read first.
This guide gives you exact kPa targets for vegetative and flowering stages, explains why LED lighting shifts those numbers, and walks through a real troubleshooting path when your VPD is off. At Grow With Hydroponics, we treat VPD as one of the highest-leverage numbers in an indoor grow room — right up there with EC and DLI — because it quietly controls how well your plants can actually use the light and nutrients you’re already giving them.
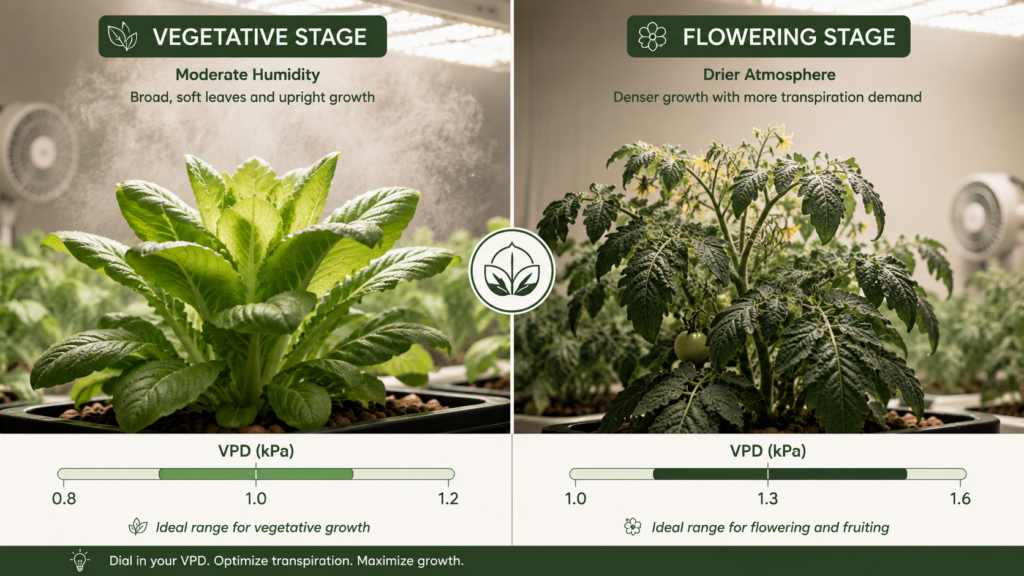
Quick Answer: VPD (Vapor Pressure Deficit) targets shift by growth stage: roughly 0.8–1.2 kPa during vegetative growth and 1.0–1.6 kPa during flowering, rising toward the higher end in late flower to reduce mold risk. LED lighting typically runs leaves cooler than HPS, so LED growers should adjust their targets slightly lower.
What Changes Between Veg and Flower VPD Targets?
Vapor Pressure Deficit measures how much “pulling power” the surrounding air has on moisture in a plant’s leaves. Low VPD means saturated air and slow transpiration; high VPD means dry air pulling moisture out fast. Vegetative plants want a moderate pull that encourages steady growth without stress. Flowering plants want a slightly stronger pull that keeps humidity down around dense flower or fruit clusters, where mold and rot are the bigger risk.
VPD Chart for Vegetative Growth
| Growth Stage | Target VPD (kPa) | Why |
|---|---|---|
| Seedling / Clone | 0.4–0.8 | Undeveloped roots can’t keep up with fast transpiration |
| Early Veg | 0.8–1.0 | Building leaf mass without drying stress |
| Late Veg | 1.0–1.2 | Sturdier plants tolerate a stronger pull, encouraging robust stems |
Seedlings sit at the low end of this range because young clones haven’t fully developed their root systems and can’t handle much stress, so growers aim for high humidity and a VPD as low as 0.5–0.7 kPa. As roots establish, the target climbs.
VPD Chart for Flowering
| Growth Stage | Target VPD (kPa) | Why |
|---|---|---|
| Early Flower / Transition | 0.8–1.1 | Bridging veg vigor into bud/fruit set |
| Mid Flower | 1.0–1.4 | Balancing nutrient uptake with mold prevention |
| Late Flower | 1.2–1.6 | Drier conditions reduce rot risk as clusters densify |
Late flower runs higher across nearly every credible source, and for good reason: dialing in late-flower VPD between 1.2–1.6 kPa supports better terpene retention and drier finishing conditions, which matters for fruiting crops and flowering ornamentals alike, not just one type of plant.
Why do published charts disagree slightly? You’ll notice ranges shift a bit between sources — some list veg as 0.8–1.1 kPa, others 0.8–1.3 kPa. That’s not inconsistency for its own sake; it typically comes down to differing plant types, differing tolerance for risk (some growers push higher VPD for faster transpiration, others stay conservative), and some sources using millibars rather than kPa as their working unit, which changes how ranges get rounded when converted. Treat any chart as a starting zone, not a single magic number, and adjust based on how your specific plants respond.
Why LED Grow Lights Change Your VPD Numbers
Here’s the part most VPD charts skip entirely: VPD should be based on leaf temperature, not room air temperature, and different lighting technologies change that gap in opposite directions.
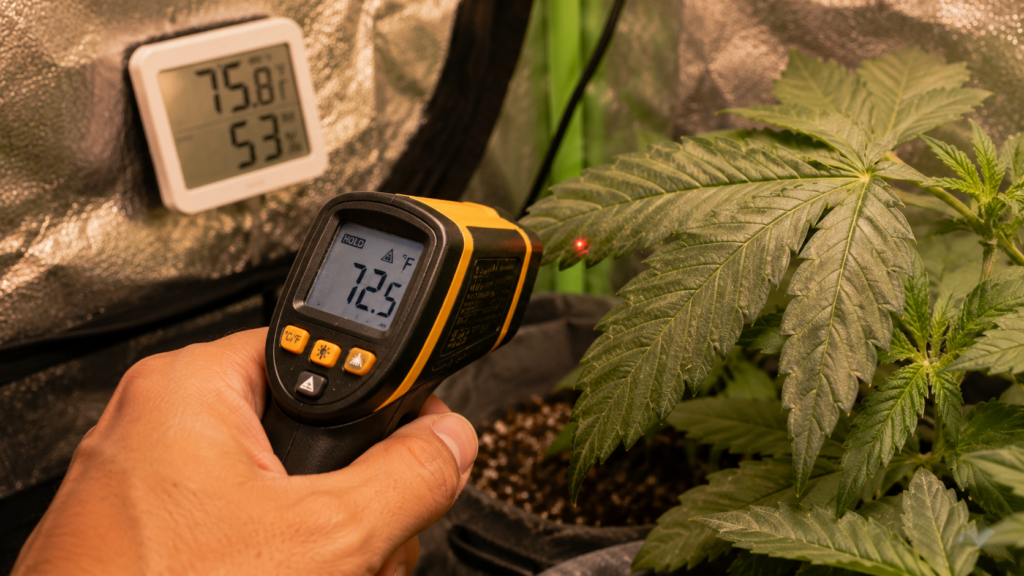
LEDs run cooler than older HPS or metal halide fixtures, and that shows up directly on the leaf surface. Leaves typically run 2–5°F cooler than ambient air due to transpiration cooling, and that delta is even more pronounced under LED, where there’s less radiant heat hitting the canopy. Following a chart built around air temperature alone will overstate your actual VPD under LED — your plants are experiencing a lower VPD than the number on your sensor suggests.
How to Correct for LED vs. HPS
| Light Type | Typical Leaf Temp Shift | Correction |
|---|---|---|
| LED | ~1°C cooler than air | Subtract roughly 0.17–0.22 kPa from your chart value |
| HPS | ~1°C warmer than air | Add roughly 0.18–0.23 kPa to your chart value |
These correction figures come from grower-reported comparisons rather than a single peer-reviewed study, so treat them as a practical starting adjustment — the honest, calibrated way to use them is to confirm with your own infrared thermometer rather than trusting the correction blindly. A cheap IR thermometer gets you most of the way there, but if you’re ready to stop eyeballing it, our breakdown of VPD meters and sensors covers which ones are actually worth the money.
The VPD Formula (For When You Want to Calculate It Yourself)
If you’d rather work from first principles: VPD = SVP × (1 − RH/100), where SVP is the saturation vapor pressure at your leaf temperature. A worked example: at 78°F (25.6°C) leaf temperature and 55% relative humidity, SVP calculates to about 3.29 kPa, giving a VPD of roughly 1.48 kPa — solidly in the ideal peak-flower range.
Doing this math by hand every time you check your tent isn’t realistic. The VPD Calculator at Grow With Hydroponics handles the formula for you — plug in temperature, humidity, and your lighting type, and it returns a corrected VPD instantly instead of asking you to look up saturation vapor pressure tables.
How to Read and Use a VPD Chart
- Measure air temperature and relative humidity at canopy height, not floor or ceiling level — those spots skew humid or dry respectively.
- Check your leaf temperature with an IR thermometer if you have one; if not, apply the LED/HPS correction above.
- Find your growth stage row on the chart and compare your current VPD to the target range.
- Adjust temperature or humidity, not both blindly — move one variable, recheck, then adjust the other if needed.
- Recheck after 20–30 minutes, since humidity and temperature take time to stabilize after any change.
Common VPD Chart Mistakes
Using room air temperature instead of leaf temperature. This is the single biggest source of “my VPD looks fine but plants are stressed” confusion, especially under LED.
Chasing the top of the flowering range too early. Pushing to 1.5–1.6 kPa in early flower before plants have built enough root mass to keep up causes the same drought-stress symptoms you’d see from underwatering.
Ignoring night-time humidity swings. VPD calculations assume lights-on conditions. When lights go off, temperature drops and humidity often spikes — a stable daytime VPD can still lead to mold-favorable conditions at night if nothing’s monitoring the dark period. Charts give you the target — actually holding that number through a full day-night cycle is a different skill. Our guide on managing VPD day to day in a hydroponic grow walks through the adjustments that keep it stable once you’ve hit the right zone.
Treating one chart number as universal across all crops. A rose in flower and a fruiting tomato plant don’t behave identically at the same VPD — these charts are a strong starting zone, not a guarantee, and some fine-tuning by observation is normal and expected.
Climate Gear for Holding VPD Steady
Hitting a target VPD on paper means nothing if your room can’t hold it. A humidifier for raising RH, a dehumidifier for late flower, and a reliable temp/humidity sensor at canopy height are the three pieces of gear that actually make chart numbers achievable day to day.
Shop Smart: Browse ventilation and humidity-control equipment at the Grow With Hydroponics shop — gear chosen for real grow-room conditions, not just spec sheets.
Gear That Actually Holds Your VPD Target
Hitting the numbers on a chart is one thing. Holding them through a 12-hour lights-on cycle is another. These are the humidifiers, dehumidifiers, and sensors growers actually rely on to keep VPD stable — not just spec sheets.


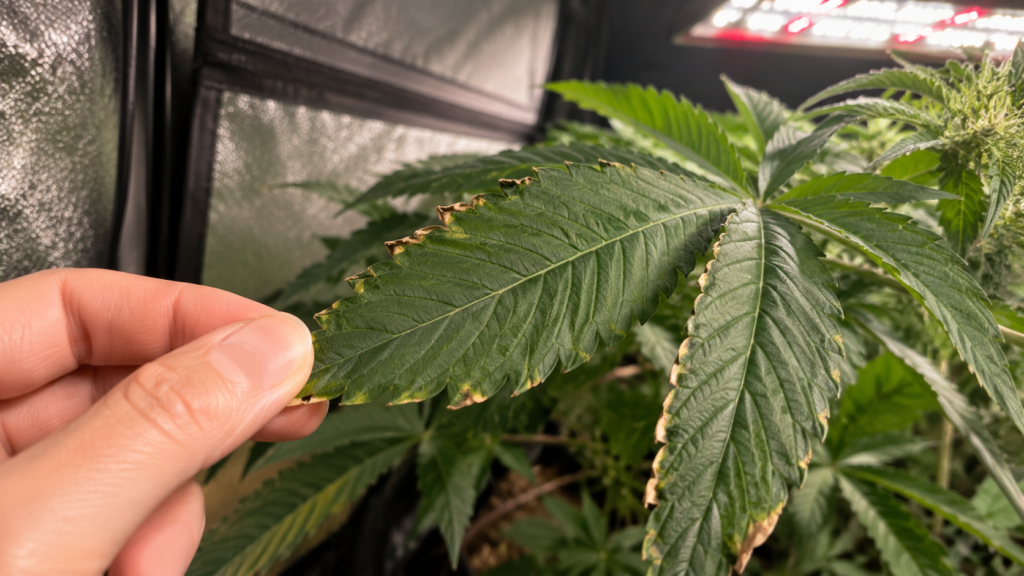
Troubleshooting: Symptom → Likely Cause → Fix
| Symptom | Likely VPD Issue | Fix |
|---|---|---|
| Leaves feel soft, mildew appearing | VPD too low | Raise temperature slightly or lower humidity |
| Curling tips, dry edges in veg | VPD too high for stage | Raise humidity 5–10%, lower temp slightly |
| Slow drying, dense/wet-feeling buds | VPD too low in flower | Increase airflow, run dehumidifier |
| Crispy edges, poor nutrient uptake late flower | VPD too high | Lower temperature 2–3°F, raise humidity slightly |
Frequently Asked Questions
What’s the ideal VPD for vegetative growth? Most vegetative growth targets fall between 0.8–1.2 kPa, starting lower for young plants and climbing as roots and stems mature. Early veg plants tolerate less stress than late veg, so starting conservative and adjusting up is safer than the reverse.
What’s the ideal VPD for flowering? Flowering VPD generally runs 1.0–1.6 kPa, with late flower pushing toward the higher end to reduce mold and rot risk in dense clusters. The exact target depends on your specific crop and how far along in flower you are.
Does LED lighting really change my VPD target? Yes — LEDs run leaves cooler than HPS, which means air-temperature-based charts can overstate your actual VPD under LED. Correcting downward by roughly 0.17–0.22 kPa, or confirming with an infrared thermometer, gives a more accurate number.
Why do different VPD charts show slightly different numbers? Charts vary because of differing crop assumptions, differing risk tolerance among growers, and unit conversion between kPa and millibars. Use any chart as a target zone and fine-tune based on how your specific plants respond over time.
Do I need a VPD meter, or can I calculate it myself? You can calculate VPD manually with the formula VPD = SVP × (1 − RH/100), but a VPD meter or calculator saves time and reduces math errors. The Grow With Hydroponics VPD Calculator does this instantly from your temperature and humidity readings.
Getting VPD Right Is a Habit, Not a One-Time Setting
VPD isn’t a set-and-forget number — it shifts with every growth stage and needs rechecking whenever you change lighting, add plants, or move into flower. Get the stage-based target right, correct for your lighting type, and you’ll catch most transpiration-related problems before they show up as stunted growth or crispy leaves.
Keep the VPD Calculator at Grow With Hydroponics bookmarked for quick checks, and revisit your targets every time your plants move to a new stage.
