
Your DLI Score: What It Means for Your Plants
So you’ve got your DLI number. Now what? Think of this as your plant’s daily energy budget—the total amount of usable light hitting each square meter of your growing space. Here’s how to read that number and know exactly what it means for your next harvest.
| DLI Range | What It Means | What Grows Here | What To Do |
|---|---|---|---|
| 0–5 | Very low light | Only the most shade-tolerant plants (some ferns, snake plants) can survive here | Supplemental lighting is essential for any edible crops |
| 5–8 | Marginal conditions | Microgreens may grow slowly; leafy greens will struggle | Start with low-light varieties and consider a small grow light |
| 8–12 | Adequate for greens | Lettuce, kale, spinach, arugula can grow—but slowly | Good for beginners; expect slower growth in winter months |
| 12–15 | Solid herb territory | Basil, parsley, cilantro, mint will do well | You’re in a good spot for kitchen herbs |
| 15–20 | Fruiting range | Cherry tomatoes, peppers, strawberries can thrive | Ideal for most hydroponic hobbyists |
| 20–25 | High production | Cucumbers, eggplants, full-sized tomatoes | Excellent light levels—watch for heat stress in summer |
| 25+ | Very intense | Fast growth for heat-loving crops | Monitor temperature and airflow; some plants may need shade |
DLI Requirements for Common Plants
Use this table to match your light level to the right crops. If your DLI falls below the “optimal” range, don’t worry—you can still grow successfully with a few adjustments.
| Crop | Optimal DLI | Minimum DLI | Notes |
|---|---|---|---|
| Lettuce & leafy greens | 12–17 | 8 | Very forgiving; good for beginners |
| Basil & culinary herbs | 12–20 | 10 | Thrives with consistent light |
| Kale & spinach | 12–18 | 8 | Cool-season crops that tolerate lower light |
| Microgreens | 6–12 | 5 | Quick harvests work well in marginal light |
| Strawberries | 15–22 | 12 | Needs good light for sweet fruit |
| Tomatoes & peppers | 15–25 | 12 | Fruiting requires higher energy input |
| Cucumbers | 20–30 | 15 | Heavy feeders; need strong light for good yields |
Not sure which crops match your space? Use the calculator above to find your DLI, then come back here to see what thrives in your conditions.
Practical Ways to Improve Low Light Conditions
Found your DLI is lower than you’d like? These three strategies have helped thousands of indoor growers turn marginal spaces into productive gardens. Pick the ones that fit your situation.
1. Add Supplemental LED Lighting
This is the most direct solution when your DLI falls short. You don’t need an expensive commercial setup—even a modest LED grow light can bridge the gap.
A simple rule of thumb: If your DLI is 5 points below your target, adding a basic full-spectrum LED for about 14 hours a day will typically get you there. For example, if your space gets 10 DLI but you want to grow basil (needs 15+), a small grow light can cover that 5-point gap.
Getting started: Look for “full spectrum” LED panels—they’re energy-efficient and mimic natural sunlight. Start with a small unit and observe how your plants respond over a few weeks.
2. Use Reflective Surfaces (A Surprisingly Easy Win)
Here’s something many growers overlook: light that hits a dark wall is essentially wasted. Light that hits a reflective surface gets a second chance to reach your plants.
What works:
White walls or white paint (reflects about 70–80% of light)
Mylar film (reflects 90%+)
Even simple white poster board or emergency blankets can help
The impact: Growers typically see a 15–25% boost in effective light levels using reflective surfaces. That’s like getting extra light without any electricity cost.
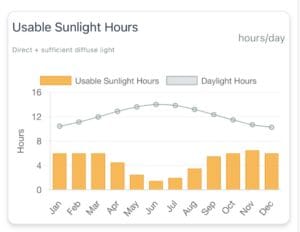
3. Plan for Seasonal Changes
This is where many indoor gardeners get caught off guard. Your winter light levels can drop by 70–90% compared to summer—even in the same window.
A seasonal approach that works:
Summer: Maximum natural light; watch for overheating near windows
Fall: Light declines gradually; start supplementing before plants show stress
Winter: Heavy reliance on artificial lighting; adjust expectations for slower growth
Spring: Natural light returns; you can gradually reduce supplemental lighting
The growers who succeed year-round aren’t the ones with perfect setups—they’re the ones who anticipate these seasonal shifts and adjust accordingly.
Real-World Example: From Low Light to Thriving Plants
Sometimes seeing how others solved a problem makes all the difference. Here’s a story we hear often—and it might sound familiar.
The situation: A home grower wanted to grow basil in what seemed like a bright apartment. The kitchen windows faced south, and during the day, the space felt sunny. But the basil plants kept coming out pale, leggy, and slow-growing. From a human perspective, everything looked fine. But plants don’t “see” light the way we do.
What the numbers showed: After running the analysis, the real issue became clear. During winter months, that “bright” space was actually receiving only 4–5 DLI—far below the 12+ DLI that basil needs for healthy growth.
The fix: Instead of guessing again, the grower added a small full-spectrum LED light and extended the daily photoperiod. This brought the DLI into the optimal range—simple, data-driven, and effective.
The result: Within weeks, the difference was obvious—stronger stems, deeper color, faster growth. Over time, that single basil plant expanded into a full herb garden, all thriving under controlled light conditions.
The takeaway: What looks “bright enough” to us is often insufficient for plants. When you measure light correctly, you stop guessing and start getting consistent results.
Frequently Asked Questions
How do I calculate DLI for my indoor plants?
Use the calculator at the top of this page. Enter your location and window details, and the tool estimates your light levels using solar positioning and environmental modeling. Takes about a minute.
What’s a good DLI for tomatoes?
Tomatoes typically need between 15–25 mol/m²/day for strong growth and good fruit production. If your space falls below that, a supplemental grow light can bridge the gap.
What’s the difference between PPFD and DLI?
PPFD measures light intensity at a single moment (like a snapshot). DLI measures total light accumulated over an entire day (like a time-lapse). DLI is the more practical number for plant growth because it accounts for both intensity and duration.
Can plants get too much light?
Yes. Very high DLI (above 30) can stress plants, causing leaf burn or reduced growth. This is more common in summer with south-facing windows. If your DLI is consistently above 25, watch for signs of heat stress and ensure good airflow.
How accurate is this tool?
The tool is built on established principles from controlled environment agriculture, combining solar position modeling, light attenuation physics, and indoor environmental assumptions. While no model is perfect, it provides accuracy within a practical range—enough to make confident decisions about lighting, crop selection, and setup design.
About the Research Behind This Tool
This tool was developed for growers who want reliable, science-based estimates without investing in expensive light meters. It combines:
Solar positioning data based on your location
Window physics (glazing type, orientation, size)
Indoor light decay modeling
Seasonal temperature patterns
The goal is simple: give you enough reliable information to make better decisions about your indoor garden. Whether you’re growing herbs on a kitchen counter or running a small hydroponic setup, understanding your light conditions is the foundation of success.
Ready to Improve Your Indoor Growing?
You now have the knowledge that many growers never take the time to learn. Instead of guessing, you can measure. Instead of trial and error, you can make informed decisions.
Here’s what to do next:
If you haven’t already, scroll up and run the calculator for your space
Check your DLI against the tables above
Pick one of the three improvement strategies that fits your situation
Start with one small change and observe what happens
Better light doesn’t just mean better growth—it means fewer frustrations, more consistent harvests, and the satisfaction of knowing exactly what your plants need.
Have questions about your specific setup? The calculator above will give you personalized recommendations based on your location and window configuration.